Besides colours, pictures and symbols form a vital part of mindmaps. Colours help to distinguish
between different aspects of the subject and also show their organization, apart from helping to
visualize the mindmaps for recall. Further, pictures and symbols aid in remembering information
more effectively than words. Also, lines or symbols are used in mindmaps to show cross-linkages
of one part to another. This helps visualise the connection among the various elements easily.
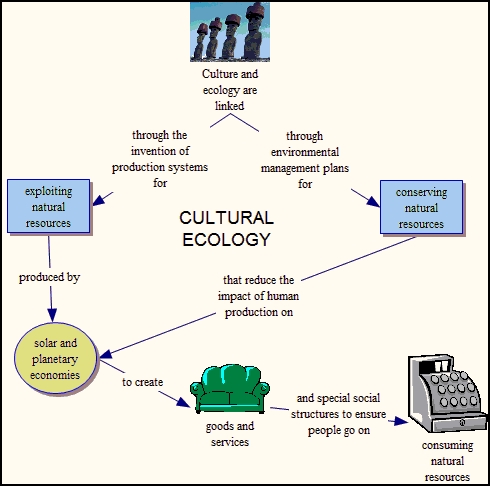
Process maps consist of concepts linked together by statements which summarise the process
that connects them. For example, the above concept map of cultural ecology says that the two
processes linking culture and ecology occur-
-
' through the invention of production systems for
exploiting natural resources produced by
solar and planetary economies to create goods and services and special social structure to
ensure people go on consuming natural resources';
-
'through environmental managment, plans for
conserving natural resources that reduce the
impact of human paroduction on solar and planetary economies'.
This arrangement is the same as the topic hierarchy map, but it it has been condensed to stress
the dynamics.